Note
Missed Tuesday’s lecture
Announcements
Assignment 2
- posted
- q1:
- options
- can be api call (express/fastapi?)
- can be socket programming via localhost
- does not need to be separate machines
- options
- takes a lot of time (have to setup OpenTelemetry, learn it, etc.)
- AI is allowed (but mention it, acknowledge how/where it was used)
- single pdf file including both info from q1 and q2
- use github repo
Final exam
- may be similar format (all multiple choice)
Instrumentation
Note
Starting at Instrumentation → slide 71
Planning for Instrumentation
- Observability Oriented Development (OOD): teams build observability directly into the code from the earliest stages, rather than adding it only after deployment
- NOTE: no definition in the slides → this is the Google definition for “observability driven design”, so i’m not 100% sure that this is real
Non-intrusive instrumentation
- Non-intrusive instrumentation: the process of collecting data from software for analytical purposes without modifying the original source code
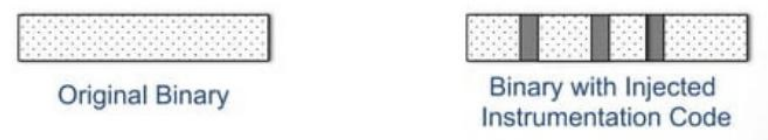
Dynamic binary instrumentation
- Dynamic binary instrumentation (DBI): a form of non-intrusive software instrumentation where instrumentation code is injected into a binary executable at runtime
- monitor both application and system level behaviour
- Pros:
- Non-invasive: instrumentation needs do not have to be tightly integrated with development process → does not require source code
- Flexibility: add/remove instrumentation code from binary on-demand → dynamically change behaviour as needed without modifying original source code
- Pros:
- Overhead: can introduce significant overhead to a program, as the insertion of probes can slow down its execution and increase memory usage
- Complexity: can be complex to implement, especially for large and complex programs, due to the need to understand the underlying machine code and internal structure of the program
- Compatibility: may not be compatible with all types of programs or operating systems, especially those with advanced features (dynamic code generation/self modifying code)
- Security: can introduce security risks → dynamic modification can alter program behaviour or introduce vulnerabilities
- Tools:
- Intel Pin: highly flexible and customizable DBI tools that supports a wide range of platforms and architecture
- DynamoRIO: open-source DBI framework
- Valgrind: open-source DBI tool
- FRIDA: DBI tool that can be used to inject code into running processes on different operating systems
Note
End of Instrumentation
Statistical debugging
- monitor deployed code
- Online: collect information from user runs
- Offline: analyze information to find bugs
- Statistical debugging: a technique used to identify the root cause of software bugs by analyzing large amounts of data collected from the execution of the program
- steps:
- collect data (opentelemetry, sampling, etc.)
- analyze/compary data of successful and unsuccessful executions
- look for patterns
- identify bugs → find facts/correlations/causality between data and bugs
- steps:
Note
got distracted, ended slide 20